








































What views, clicks, CTR, conversions and CVR mean on the dashboard, how the comparison works and what your plan shows.
The dashboard is the home page after you sign in. It adds up the numbers of all pages in your workspace or shows a single page. All roles – viewer, editor, admin and owner – can see it. Here you learn what each tile and each card means and which parts are added from Creator Pro.
Choose the period and scope
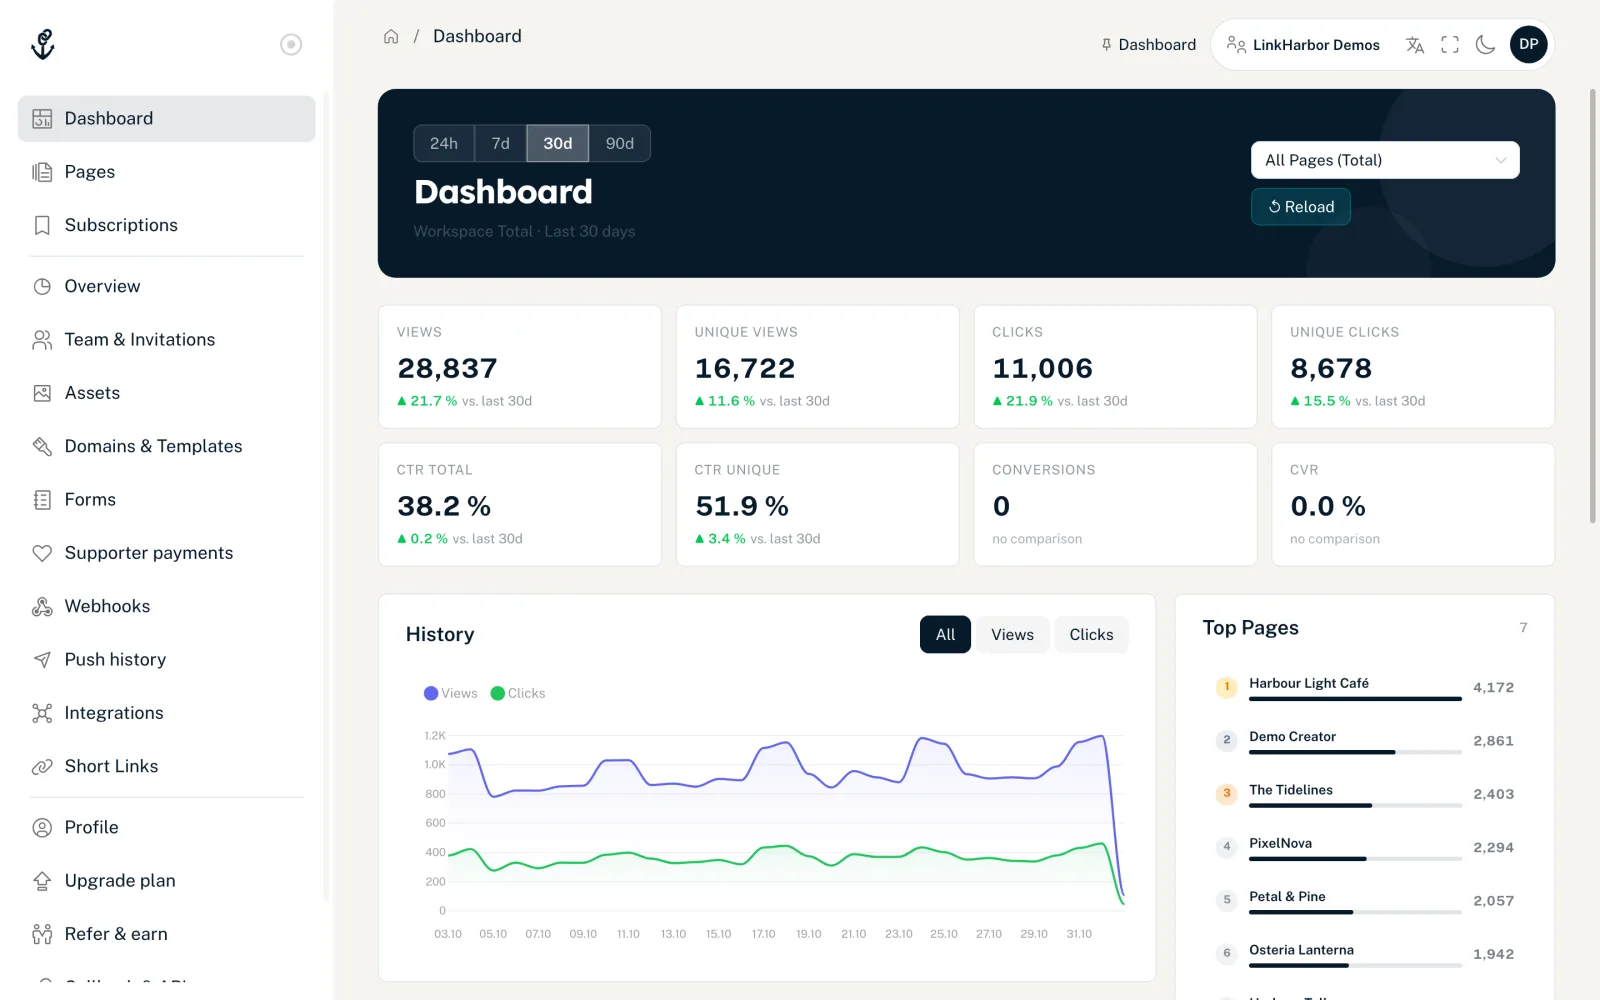
At the very top, in the dark header area, you set which data you want to see. The heading below always shows what is currently selected, for example “Workspace Total · Last 30 days”.
- “24h”, “7d”, “30d”, “90d”
- The period that all tiles and cards evaluate. The default is “30d”.
- “All Pages (Total)”
- The selector to the right of it. By default, the dashboard adds up all pages in the workspace. If you choose a single page, the dashboard reloads all numbers for that page only.
- “↺ Reload”
- Fetches the latest numbers without reloading the page.
The eight metric tiles
| Tile | Meaning |
|---|---|
| Views | How often your page(s) were opened in the period |
| Unique Views | Views where each visitor counts only once |
| Clicks | Clicks on links and clickable blocks of your page(s) |
| Unique Clicks | Clicks where each visitor counts only once |
| CTR Total | Click-through rate: clicks divided by views |
| CTR Unique | Unique clicks divided by unique views |
| Conversions | Reported sales and supporter payments that are attributed to a click |
| CVR | Conversion rate: conversions in relation to clicks |
Below each tile is the percentage change compared with the previous period of the same length, for example “vs. last 30d”. If there is no value to compare with, it says “no comparison”.
What exactly a conversion is and how you report sales from your shop is explained in Attributing conversions and sales. What counts as a view or click and what LinkHarbor filters out, such as bots, is in How LinkHarbor counts.
The cards below the tiles
Below the tiles come several cards with details. They are part of the historical statistics and are available from Creator Pro.
- “History”
- Area chart over the selected period. The “All”, “Views” and “Clicks” toggles show and hide individual lines.
- “Top Pages”
- Up to 7 pages with the most views. Clicking a page selects it as the scope.
- “Top Links”
- Only appears when a single page is selected. Shows up to 8 links with the columns Link, Share, Clicks and Unique.
- “Conversions”
- Up to 8 entries, grouped by the UTM source and medium of the click. Without UTM data it says “(direct)”. Without any data, “No conversion data” appears.
- “Breakdown Analysis”
- A breakdown by the “Geo”, “Device”, “Referrer” and “UTM” tabs with the columns Share, Views and CTR.
Breakdown analysis in detail
- “Geo” shows your visitors' countries
- “Device” separates by device type, for example Mobile, Tablet and Desktop
- “Referrer” shows which websites visitors came from
- “UTM” has the sub-tabs “Source / Medium” and “Campaign”; “Campaign” is only active when a single page is selected
- The “Search…” field filters the entries
- 10 rows are shown, with a line below such as “+12 more — refine search”
What Creator Free shows
On Creator Free you see the totals in the metric tiles. The comparison with the previous period, the history chart, the top lists, the Conversions card and the breakdown analysis are only available from Creator Pro. Instead of the cards, a blurred overlay appears with the note “Historical statistics are available from Creator Pro.” and the “Upgrade Plan” button.
| Creator Free | Creator Pro | Creator Agency | Enterprise | |
|---|---|---|---|---|
| Totals in the tiles | Yes | Yes | Yes | Yes |
| Comparison with the previous period | No | Yes | Yes | Yes |
| History, Top Pages, Top Links | No | Yes | Yes | Yes |
| Conversions and breakdown analysis | No | Yes | Yes | Yes |
| How far back statistics go | 30 days | 365 days | 365 days | 730 days |
Frequently asked questions
Why are the tiles empty?
As long as nobody has opened your published page, there is nothing to count. Check that the page is really live – see Publishing and versions.
Does the dashboard also show usage?
No. How many pages, links or short links you are already using is shown in the workspace overview. The statistics of a single page with its own date range are in the page's “Statistics” tab, described in Page statistics.
Can I export the numbers?
There is no export in the dashboard. Developers can fetch metrics with an API key that has the “Read” permission for “Statistics”, see API endpoints.
You might also find this useful
Nothing found?
Tell us what you need, and our support team will help you personally.